Sandbar Analysis Results
Perform the following steps to view the results of the sandbar analysis. There is a video demonstration of this feature at the bottom of this page.
- Open the GCMRC Workbench
- Select the
Sandbar Sitesfrom theViewsmain menu. - Double click the individual sandbar site for which you want to view the results
- Switch to the
Area & Volume Analysestab.
The screen that appears displays the results of both the incremental and binned sandbar analysis.
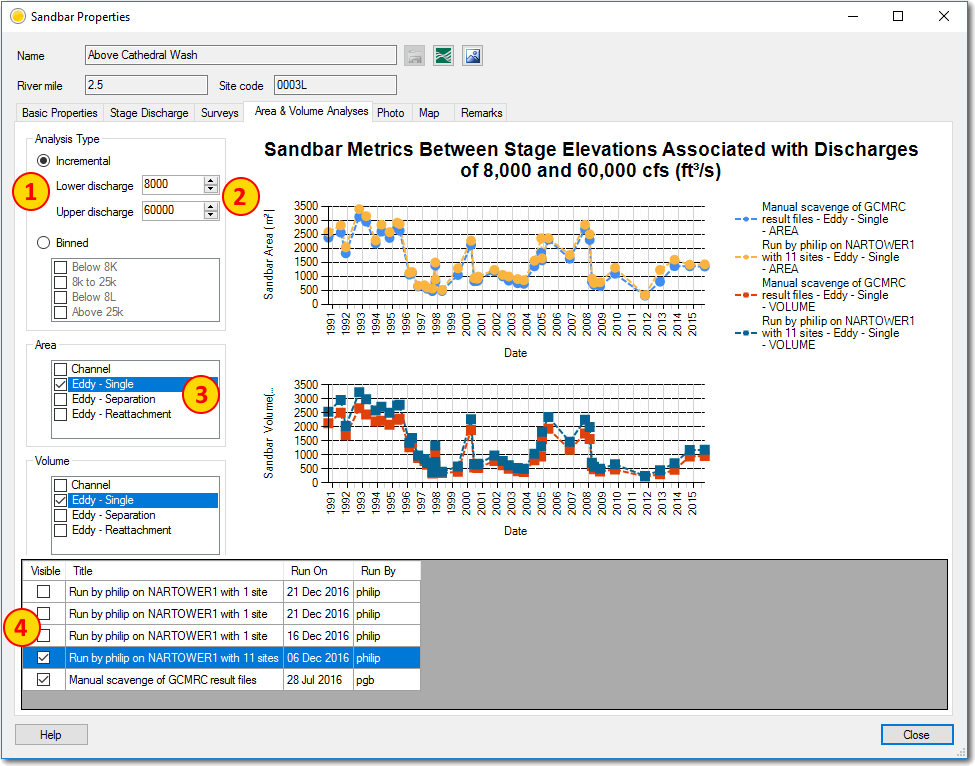
Increment Analysis Results
To view the incremental results:
- Select the
Incrementalanalysis type option. - Enter the lower and upper discharge values.
- Check one or more channel section checkboxes. Note that only Eddy - Single results areavailable for single eddy sandbar sites and separation and reattachment results are only available for double eddy sandbar sites.
- Check one or more analysis runs.
The plot is only populated once all four steps have been completed. Note also that changing the options will change the color associated with each series on the plot. This can make it confusing as the meaning of each data series color changes with each click. It is important to keep reviewing the legend in the top right of the plot to clarify the color associated which each data series. This will be addressed in a future version.
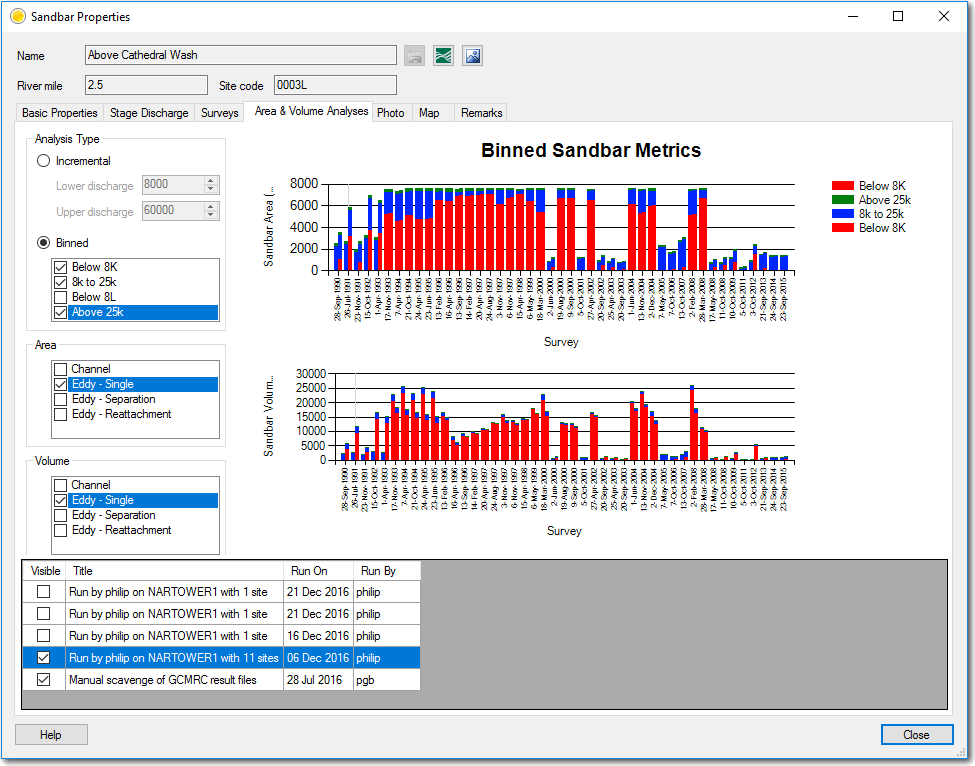
Binned Analysis
Use a similar process for viewing the binned analysis results. The only difference being that you need to select which bins you want to view, as opposed to the discharge thresholds.
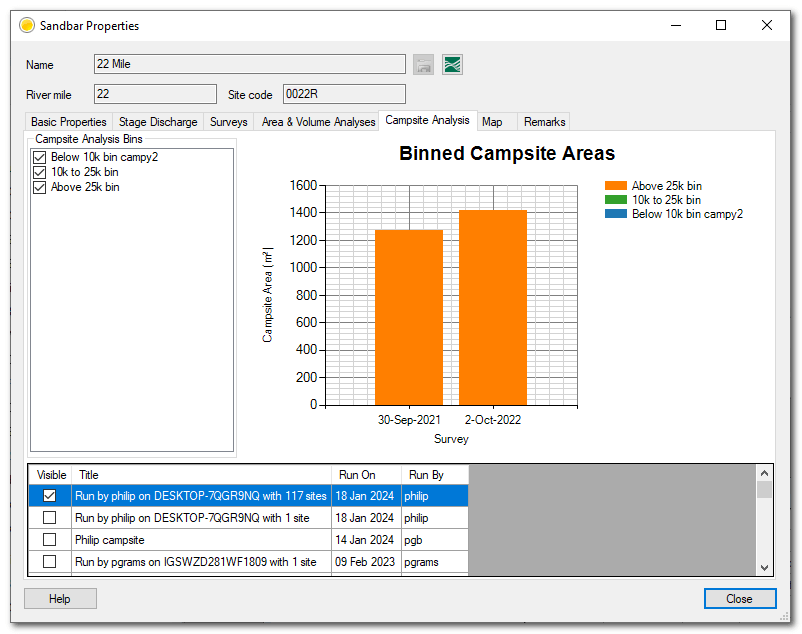
Campsite Analysis
A new tab dedicated to campsites analyses allows you to view the areas of campsites within elevation bins. Use a similar approach to viewing the binned analysis; first pick the bins you want to visualize then pick a model run.
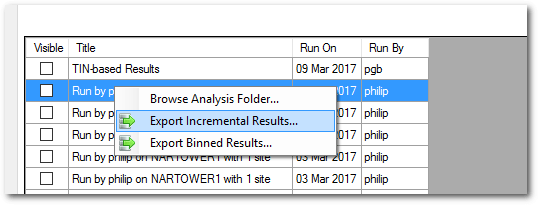
Exporting analysis Results
The tabular results for each analysis can be exported to comma separated value (CSV) text file by right clicking on the analysis result in question and choosing which type of analysis - incremental or binned - that you want to export.