Stage Discharge Curves
The Workbench maintains must stage discharge relationships for each sandbar site. Over time the stage discharge curve calibration might depart from the historical samples and require recalibrating. Each stage discharge relationship possesses an “effective date” and is used for all analyses after this date and until the date that the next relationship takes effect.
Viewing Stage Discharge Relationships
To view the stage discharge samples for a particular sandbar site:
- Open the GCMRC Workbench.
- Choose
Sandbar Sitesfrom the mainViewsmenu. - Select a single sandbar site in the list and then either double click it or right click and choose
View Propertiesto open the property view of the sandbar site. - Click on the
Stage Dischargetab.
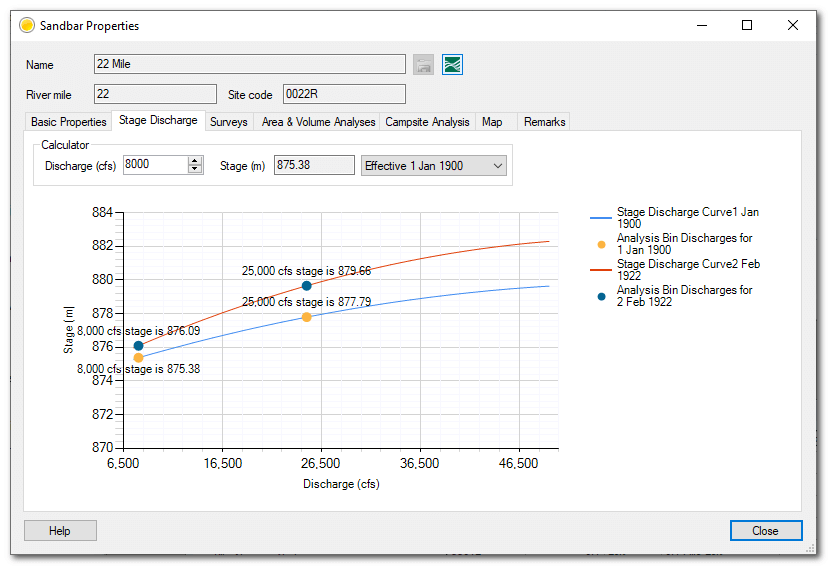
The stage discharge tab contains several elements:
- A stage discharge calculator (top left) for manually calculating stage values for a specific discharge/
- Chart showing:
- All stage discharge relationships for the current site.
- Key discharge bin boundaries (nominally 8,000 and 25,000 CFS)
- The current manually calculated stage discharge point (red dot)
Stage Discharge Calculator
You can calculate the stage for any particular discharge using the calculator at the top of this form. Ensure you have picked the correct stage discharge curve from the dropdown and then enter a discharge value. The stage will be calculated using the selected relationship.
Managing Stage Discharge Curves
Stage discharge curves are managed directly by editing the Workbench SQLite database. Open the database using your preferred database software such as SQLite Studio, DB Browser or DataGrip.
Open the table called StageDischargeParams. Filter to desired site and the add, edit or delete records as necessary.